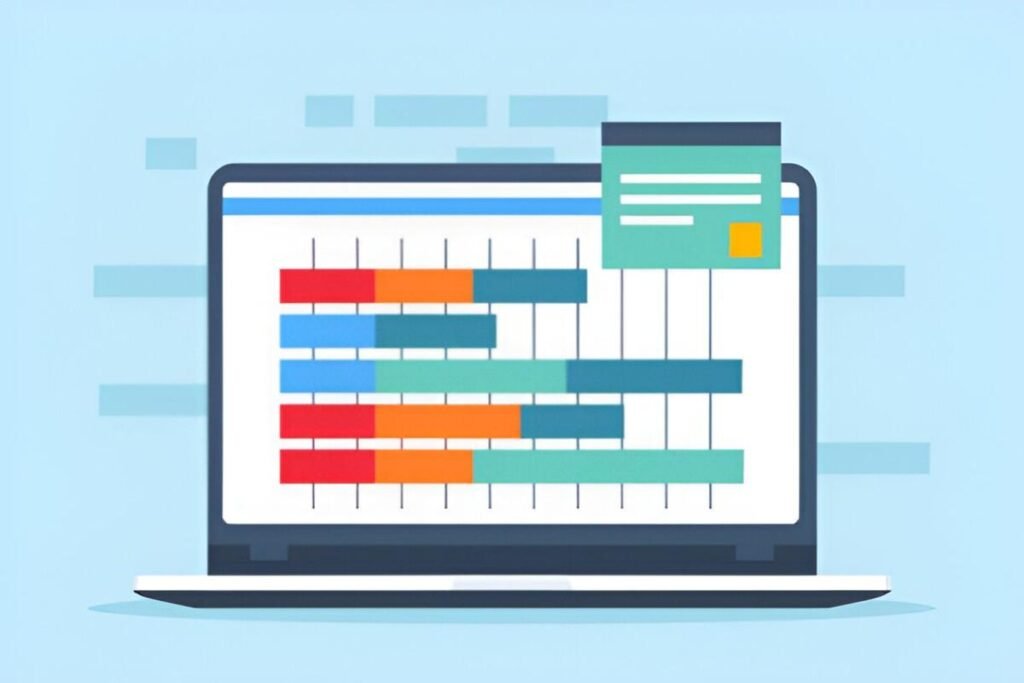
This Inventory Management Gantt Chart Excel Template is a dynamic and visually intuitive tool designed to help businesses plan, track, and manage inventory-related tasks effectively. Whether you’re an operations manager, supply chain professional, or small business owner, this template provides a structured framework for organizing tasks, monitoring progress, and ensuring timely completion of key activities.
Key Features:
- Task Breakdown : Includes predefined categories such as Team Formation, Market Research, Setting Objectives, Inventory Tracking Strategy, and Developing Action Plans.
- Progress Tracking : Visualize task progress with color-coded statuses (Completed, Ongoing, Upcoming) and percentage completion indicators.
- Customizable Lead Assignments : Assign specific team members or departments to each task by inputting their names in the designated fields.
- Dynamic Progress Bars : Automatically updates progress bars based on the percentage of completion entered for each task.
- Completion Status Indicators : Clearly categorizes tasks into “Completed,” “Ongoing,” or “Upcoming” for quick reference.
- Scalable Design : Accommodates additional tasks or phases, making it suitable for businesses of all sizes and industries.
Use Cases:
- Operations Managers : Plan and monitor inventory management projects to ensure alignment with business objectives.
- Supply Chain Professionals : Track the progress of inventory-related initiatives, from research to implementation.
- Small Business Owners : Simplify task management for inventory planning without investing in complex project management tools.
- Team Leaders : Assign responsibilities and track team performance across various stages of inventory management.
How It Works:
This Inventory Management Gantt Chart Excel Template is designed to be intuitive and user-friendly. Here’s how it works:
- Input Task Details : Enter the names of tasks (e.g., Team Formation, Market Research) under the “Task” column. Add responsible team members or leads in the “Lead” column.
- Update Completion Percentages : Input the percentage of completion for each task in the “Completion” column. The template will automatically update the corresponding progress bar.
- Track Progress Status : Use the predefined categories (“Completed,” “Ongoing,” “Upcoming”) to categorize each task based on its current status.
- Visualize Progress : The chart dynamically updates to display progress bars for each task, providing a clear overview of your project timeline.
- Expand as Needed : Add new tasks or phases to the chart to accommodate evolving project requirements.


