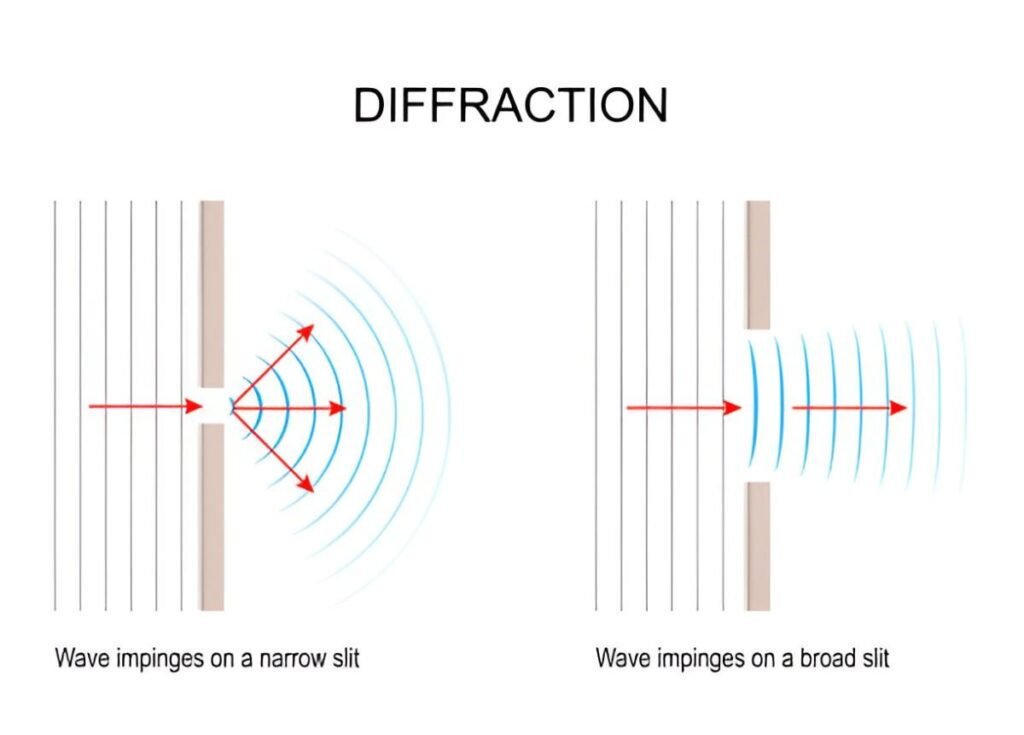
For researchers and engineers working with materials science, especially in epoxy characterization, the Epoxy Diffraction Profile Excel Template is a ready-to-use tool designed to visualize and analyze diffraction intensity patterns across varying angles.
Key Features:
Customizable input fields for angles (2θ) and corresponding intensity values.
Automatic chart generation of the diffraction profile for clear visualization.
Simple layout suited for quick entry of lab or experimental data.
Supports multiple profile entries for comparative studies.
Use Cases:
Material scientists documenting the crystalline structure of epoxy compounds.
Lab technicians analyzing diffraction data from XRD experiments.
Students learning about diffraction techniques and epoxy behavior under analysis.
Manufacturers validating material quality through structural profiles.
How It Works:
Input your measured 2θ angles and diffraction intensities into the respective fields.
The built-in chart will dynamically update, providing a visual representation of the diffraction profile.
Use the output for reports, presentations, or comparison against reference data.


