This Matrix Organizational Chart Excel Template is a dynamic and visually intuitive tool designed to help businesses, project managers, and team leaders map out and manage matrix-style organizational structures effectively. Whether you’re overseeing cross-functional teams, managing multiple projects, or aligning resources across departments, this template provides a structured framework for organizing roles, responsibilities, and reporting lines.
Key Features:
- Role Breakdown : Includes predefined categories such as employee names, roles, departments, and reporting managers.
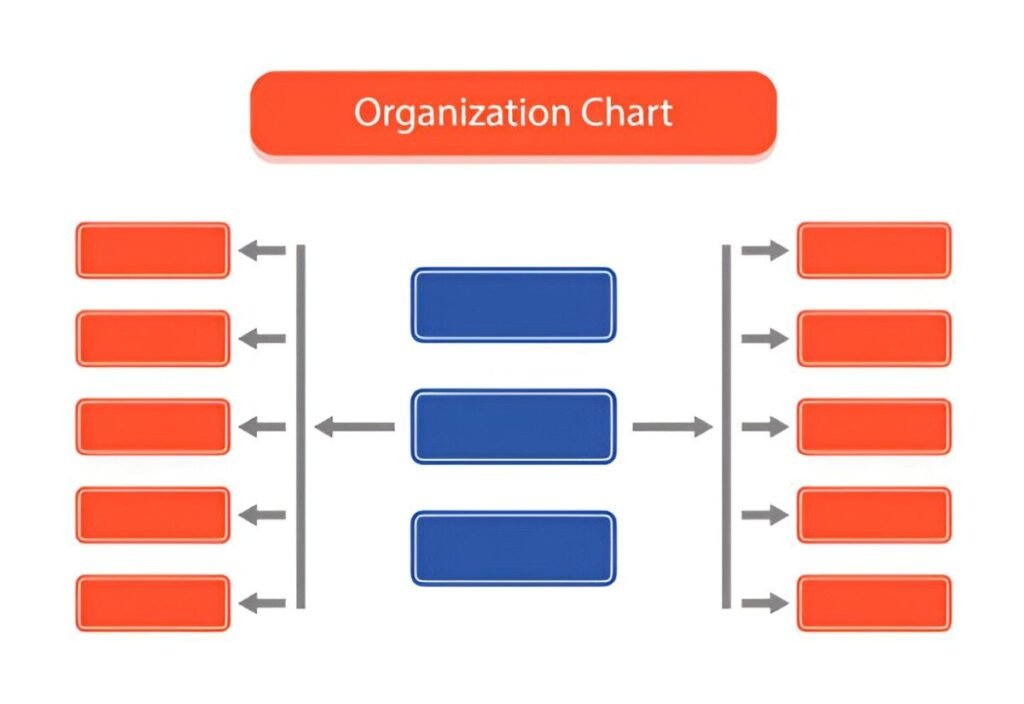
- Cross-Functional Teams : Visualize team structures with color-coded sections that represent different departments or project teams.
- Dynamic Layout : Automatically adjusts the chart based on inputted roles and relationships, ensuring real-time updates.
- Customizable Fields : Input details such as team member names, assigned projects, and direct supervisors to tailor the chart to your specific needs.
- Clear Reporting Lines : Clearly marks reporting relationships within the organization to help prioritize communication and accountability.
- Professional Design : Clean layout ensures ease of use and professional presentation, suitable for internal tracking or stakeholder reporting.
Use Cases:
- Project Managers : Track the progress and alignment of team members across various projects and departments.
- HR Managers : Use this template to design and communicate matrix organizational structures without investing in complex HR tools.
- Business Owners : Monitor resource allocation and ensure alignment with business goals.
- Team Leaders : Simplify the process of managing cross-functional teams by clearly defining roles and responsibilities.
How It Works:
This Matrix Organizational Chart Excel Template is designed to be intuitive and user-friendly. Here’s how it works:
- Input Role Details : Enter the team member names, roles, departments, and reporting managers in the designated fields under the respective columns.
- Assign Projects : Specify the projects or tasks each team member is responsible for in the “Assigned Projects” column.
- Track Reporting Lines : Update the reporting relationships to reflect the current organizational structure. The chart will automatically adjust to show clear reporting lines.
- Mark Departments : Identify key departments within the organization and mark them in the chart for easy reference.
- Review Structure : Use the dynamic chart to visualize the entire organizational structure, including cross-functional teams, dependencies, and reporting lines.


