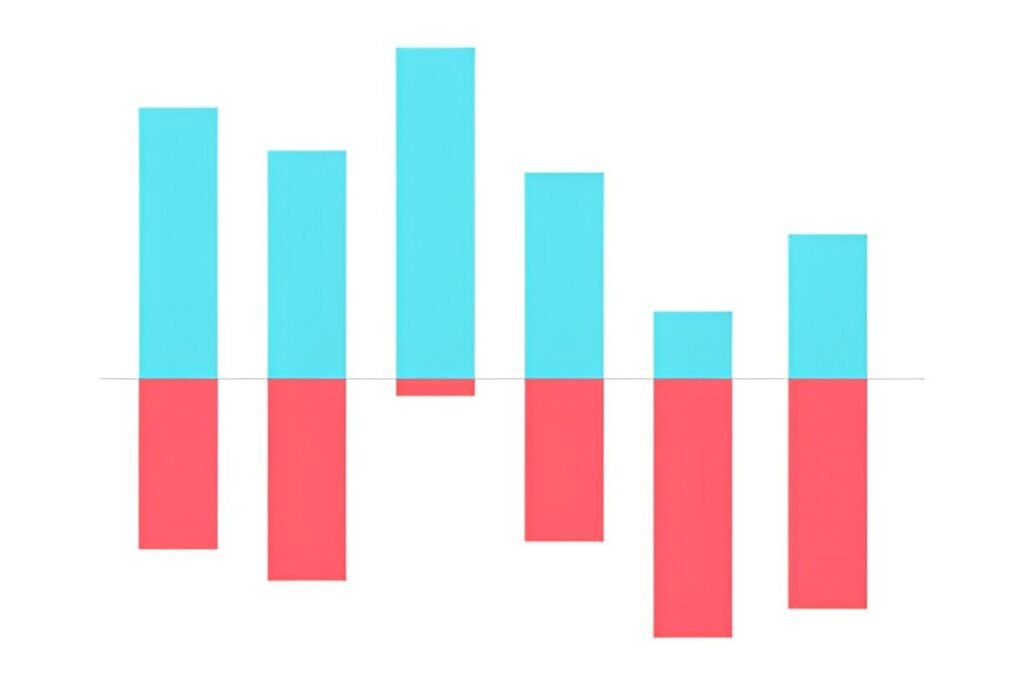
This Waterfall Chart Excel Template is a professional and dynamic tool designed to help businesses, analysts, and individuals visualize financial or numerical data transitions effectively. Whether you’re analyzing profit and loss statements, tracking project budgets, or presenting incremental changes in data, this template ensures that all values are clearly outlined and visually represented for better communication. With its user-friendly layout and customizable features, it’s perfect for organizations, teams, and individuals across industries.
Key Features:
- Dynamic Waterfall Chart : Includes a pre-formatted waterfall chart that updates automatically as you input data, saving time and effort in creating visual representations.
- Customizable Data Fields : Easily modify labels, pillars, and delta values to fit your specific analysis needs.
- Professional Design : Provides a polished and visually appealing format for presenting data transitions, ensuring clarity and professionalism.
- Error Handling : Automatically handles errors in data input (e.g., missing or invalid values) to ensure the chart remains functional.
- Scalable Design : Add or remove rows to accommodate changes in scope or additional data points as needed.
- Print-Friendly Format : Designed for easy printing, making it simple to share with stakeholders, team members, or clients.
Use Cases:
- Financial Analysts : Analyze profit and loss statements or cash flow transitions to identify key drivers of financial performance.
- Project Managers : Track budget allocations and expenditures to ensure projects stay within financial limits.
- Business Owners : Present sales or revenue changes to stakeholders in a clear and concise manner.
- Educators and Students : Teach or learn about financial analysis and data visualization techniques.
How It Works:
- Input Data Details : Begin by entering the labels, pillar indicators (‘x’ for full columns), and delta values under appropriate columns in the provided table.
- Edit Pillars and Deltas : Use the “Pillar” column to indicate which values should be shown as full columns. Ensure delta values reflect the incremental changes between data points.
- Visualize Transitions : The waterfall chart will automatically update to reflect the entered data, showing how values transition from the starting point to the endpoint.
- Adjust Formatting : Customize the appearance of floating bars, connecting lines, and data labels by editing the chart elements (e.g., error bars, line styles).
- Monitor Results : Review the completed waterfall chart regularly to ensure accurate representation and address any discrepancies promptly.
- Save and Share : Save the file digitally for ongoing updates or print it for presentations or reports.
With its focus on clarity and usability, this Waterfall Chart Excel Template simplifies the complexities of visualizing data transitions. Download now to streamline your processes and achieve your analytical goals efficiently!


