This Weekly Analysis Dashboard Excel Template is a professional and dynamic tool designed to help businesses, teams, and individuals track and analyze weekly performance metrics effectively. Whether you’re monitoring project progress, sales performance, or operational efficiency, this template ensures that all key data points are clearly outlined, visualized, and analyzed for better decision-making. With its user-friendly layout and customizable features, it’s perfect for organizations, teams, and individuals across industries.
Key Features:
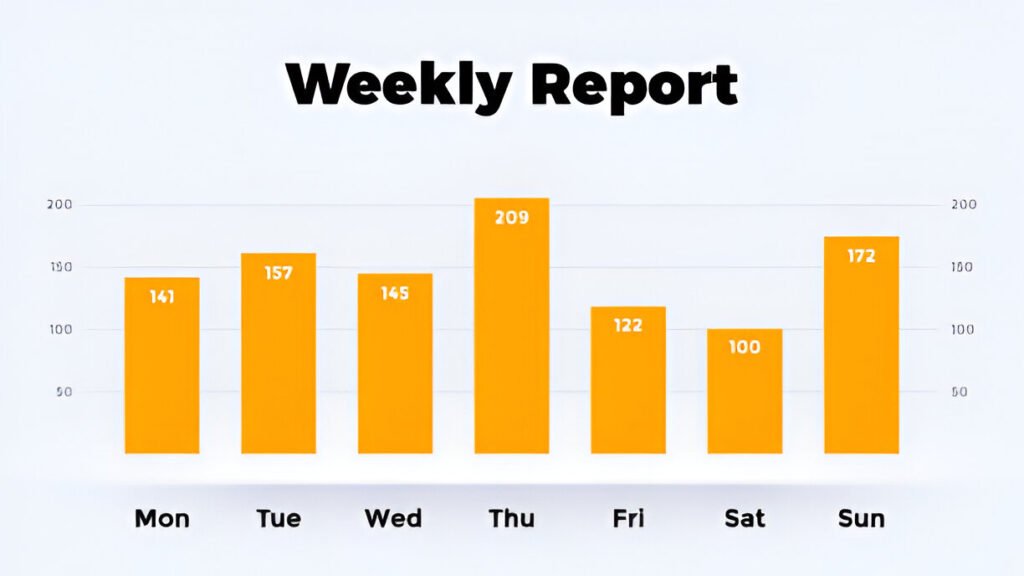
- Interactive Dashboards : Includes pre-built charts (e.g., bar charts, line graphs) that automatically update based on input data, providing real-time insights into weekly trends.
- Customizable Metrics : Easily modify categories (e.g., Progress vs. Date, Goal Tracking) to fit your specific analysis needs.
- Professional Design : Provides a polished and visually appealing format for presenting weekly performance results, ensuring clarity and professionalism.
- Data Filters : Includes filters to segment data by day, week, or other criteria, enabling detailed analysis.
- Scalable Design : Adjust the dashboard size or scale to accommodate changes in scope or additional goals as needed.
- Print-Friendly Format : Designed for easy printing, making it simple to share with stakeholders, team members, or clients.
Use Cases:
- Project Managers : Monitor weekly progress toward milestones and ensure alignment with deadlines while tracking deliverables.
- Sales Teams : Track weekly sales targets and motivate teams by visually representing progress.
- Individuals : Track personal goals, such as fitness milestones or savings targets, to stay motivated and organized.
- Educators and Students : Teach or learn about data visualization and progress tracking in goal-setting and project management.
How It Works:
- Input Goal Details : Begin by entering your target goal value (e.g., Goal ) and daily progress values (e.g., Mon, Tues, Wed ).
- Log Current Progress : Input the current progress value for each day to reflect how much has been achieved so far.
- Track Progress : The dashboard will automatically update to visually represent the percentage of progress toward the goal.
- Highlight Achievements : Use color-coding or labels to emphasize achievements or areas needing attention.
- Monitor Status : Review the dashboard regularly to ensure progress is on track and address any delays promptly.
- Customize and Share : Modify colors, labels, or sections to better fit your project or organizational needs. Save the file digitally for ongoing updates or print it for presentations.
With its focus on clarity and usability, this Weekly Analysis Dashboard Excel Template simplifies the complexities of tracking and visualizing progress. Download now to streamline your processes and achieve your goals efficiently!


