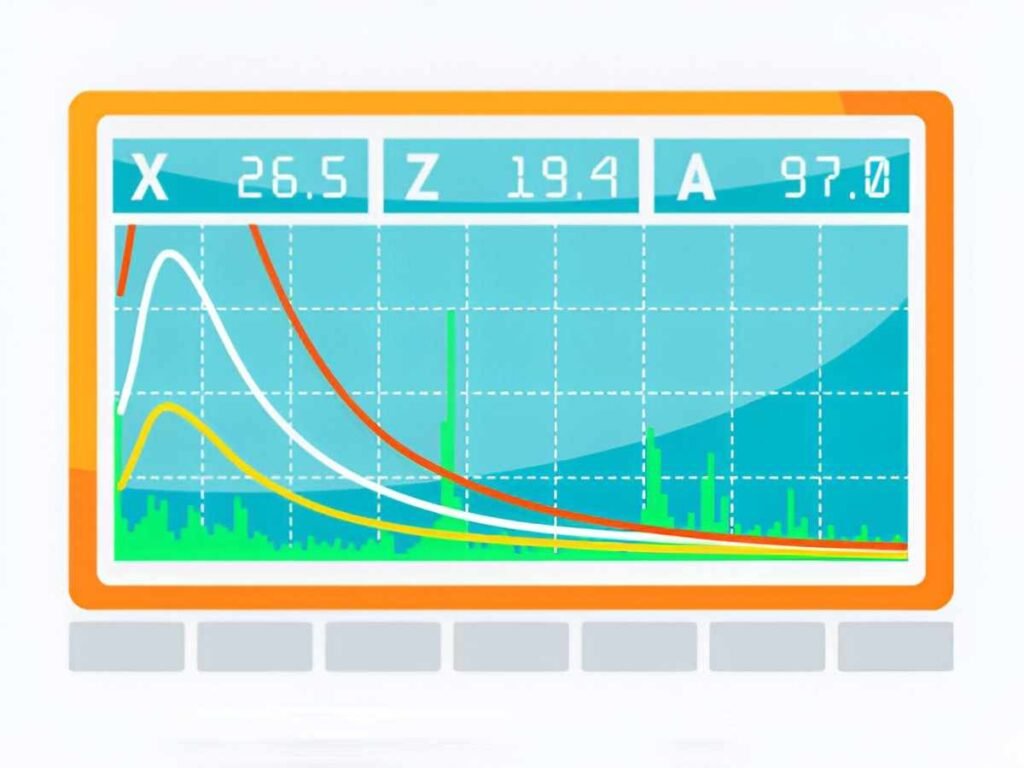
Precise crystalline material analysis made accessible with our specialized Rocking Curve Excel template.
This advanced Excel template is designed specifically for materials scientists, semiconductor researchers, and crystallographers who need to analyze X-ray diffraction rocking curve data. Unlike standard graphing tools, this template is optimized for the specialized requirements of rocking curve measurements and interpretation.
Key Features:
- Dedicated data import section for rocking curve measurement data from various diffractometer systems
- Automatic FWHM (Full Width at Half Maximum) calculation for crystal quality assessment
- Built-in curve fitting tools for Gaussian, Lorentzian, and Pseudo-Voigt profiles
- Mosaic spread calculation and visualization tools
- Automated peak position detection and analysis
- Comparative analysis capabilities for multiple samples or measurements
- Dislocation density estimation based on rocking curve broadening
- Customizable visualization options for publication-quality graphs
Whether you’re characterizing epitaxial layers, analyzing substrate quality, or investigating strain in thin films, this template streamlines your data analysis workflow. The intuitive design allows researchers to focus on interpretation rather than computation, making advanced crystalline analysis accessible to both experienced crystallographers and newcomers to the field.
Download this template to enhance your X-ray diffraction analysis capabilities and gain deeper insights into your crystalline materials!


